Platform Observability
This guide will help you install, configure and use an observability stack in your Jenkins X cluster.
We selected the Grafana stack because:
- it’s open-source
- it has support for logs, metrics, and distributed traces
- it has a low memory footprint, and a great Kubernetes integration
Installation
Please follow the usual getting started guide for boot and helm 3 first.
The first step is to edit your main helmfile.yaml file located in the root directory of your development environment git repository, so that it references the helmfiles/jx-observability/helmfile.yaml file, such as:
helmfiles:
- path: helmfiles/jx/helmfile.yaml
- path: helmfiles/jx-observability/helmfile.yaml
- path: helmfiles/tekton-pipelines/helmfile.yaml
...
The second step is to create the helmfiles/jx-observability/helmfile.yaml file, with the following content:
namespace: jx-observability
repositories:
- name: jxgh
  url: https://jenkins-x-charts.github.io/repo
- name: grafana
  url: https://grafana.github.io/helm-charts
- name: prometheus-community
  url: https://prometheus-community.github.io/helm-charts
releases:
- chart: jxgh/grafana-dashboard
  name: grafana-dashboard
- chart: grafana/loki
  name: loki
- chart: grafana/promtail
  name: promtail
- chart: grafana/tempo
  name: tempo
- chart: grafana/grafana
  name: grafana
- chart: prometheus-community/prometheus
  name: prometheus
Commit and push these changes, and after a few minutes you should see grafana, loki, promtail, tempo, and prometheus pods running in the jx-observability namespace:
$ kubectl get pod -n jx-observability
NAME                                             READY   STATUS    RESTARTS   AGE
grafana-5858dbfcc4-ldhtc                         2/2     Running   0          8m25s
loki-0                                           1/1     Running   0          10m
prometheus-alertmanager-8697d479dd-9nqt7         2/2     Running   0          10m
prometheus-kube-state-metrics-685b975bb7-cds8s   1/1     Running   0          10m
prometheus-node-exporter-djdr6                   1/1     Running   0          10m
prometheus-server-65ff7b48dd-kqj2d               2/2     Running   0          10m
promtail-f26j8                                   1/1     Running   0          10m
tempo-0                                          1/1     Running   0          10m
Who’s who
- Promtail collects the logs from all running containers
- it is deployed as a daemonset on every node of the cluster so that it can read the Kubernetes log files
- Loki ingests the logs - pushed by promtail - and exposes a query API
- Tempo ingests the traces - pushed by the applications or an agent such as the OpenTelemetry Collector - and exposes a query API
- Prometheus (server) collects and ingests the metrics from the running pods
- Prometheus Alertmanager handles alerts - generated by Prometheus server, Loki or Grafana
- Prometheus Node Exporter collects hardware- and kernel-related metrics
- it is deployed as a daemonset on every node of the cluster
- Kube State Metrics collects metrics from the Kubernetes API
- Grafana is the UI that brings everything together
- Grafana Dashboard is a Helm Chart that contains Grafana Dashboards for Jenkins X, stored in Kubernetes ConfigMaps
Usage
Grafana is exposed through an ingress - you can retrieve its URL with the following command:
$ kubectl get ing -n jx-observability
The default credentials are stored in the grafana Kubernetes Secret:
- the default user is
admin - the default password has been auto-generated at installation time, you can retrieve it with the following command:
$ kubectl -n jx-observability get secret grafana --template='{{index .data "admin-password"}}' | base64 --decode
Once you are logged in, you can play with the pre-defined dashboards, or with the Grafana Explorer.
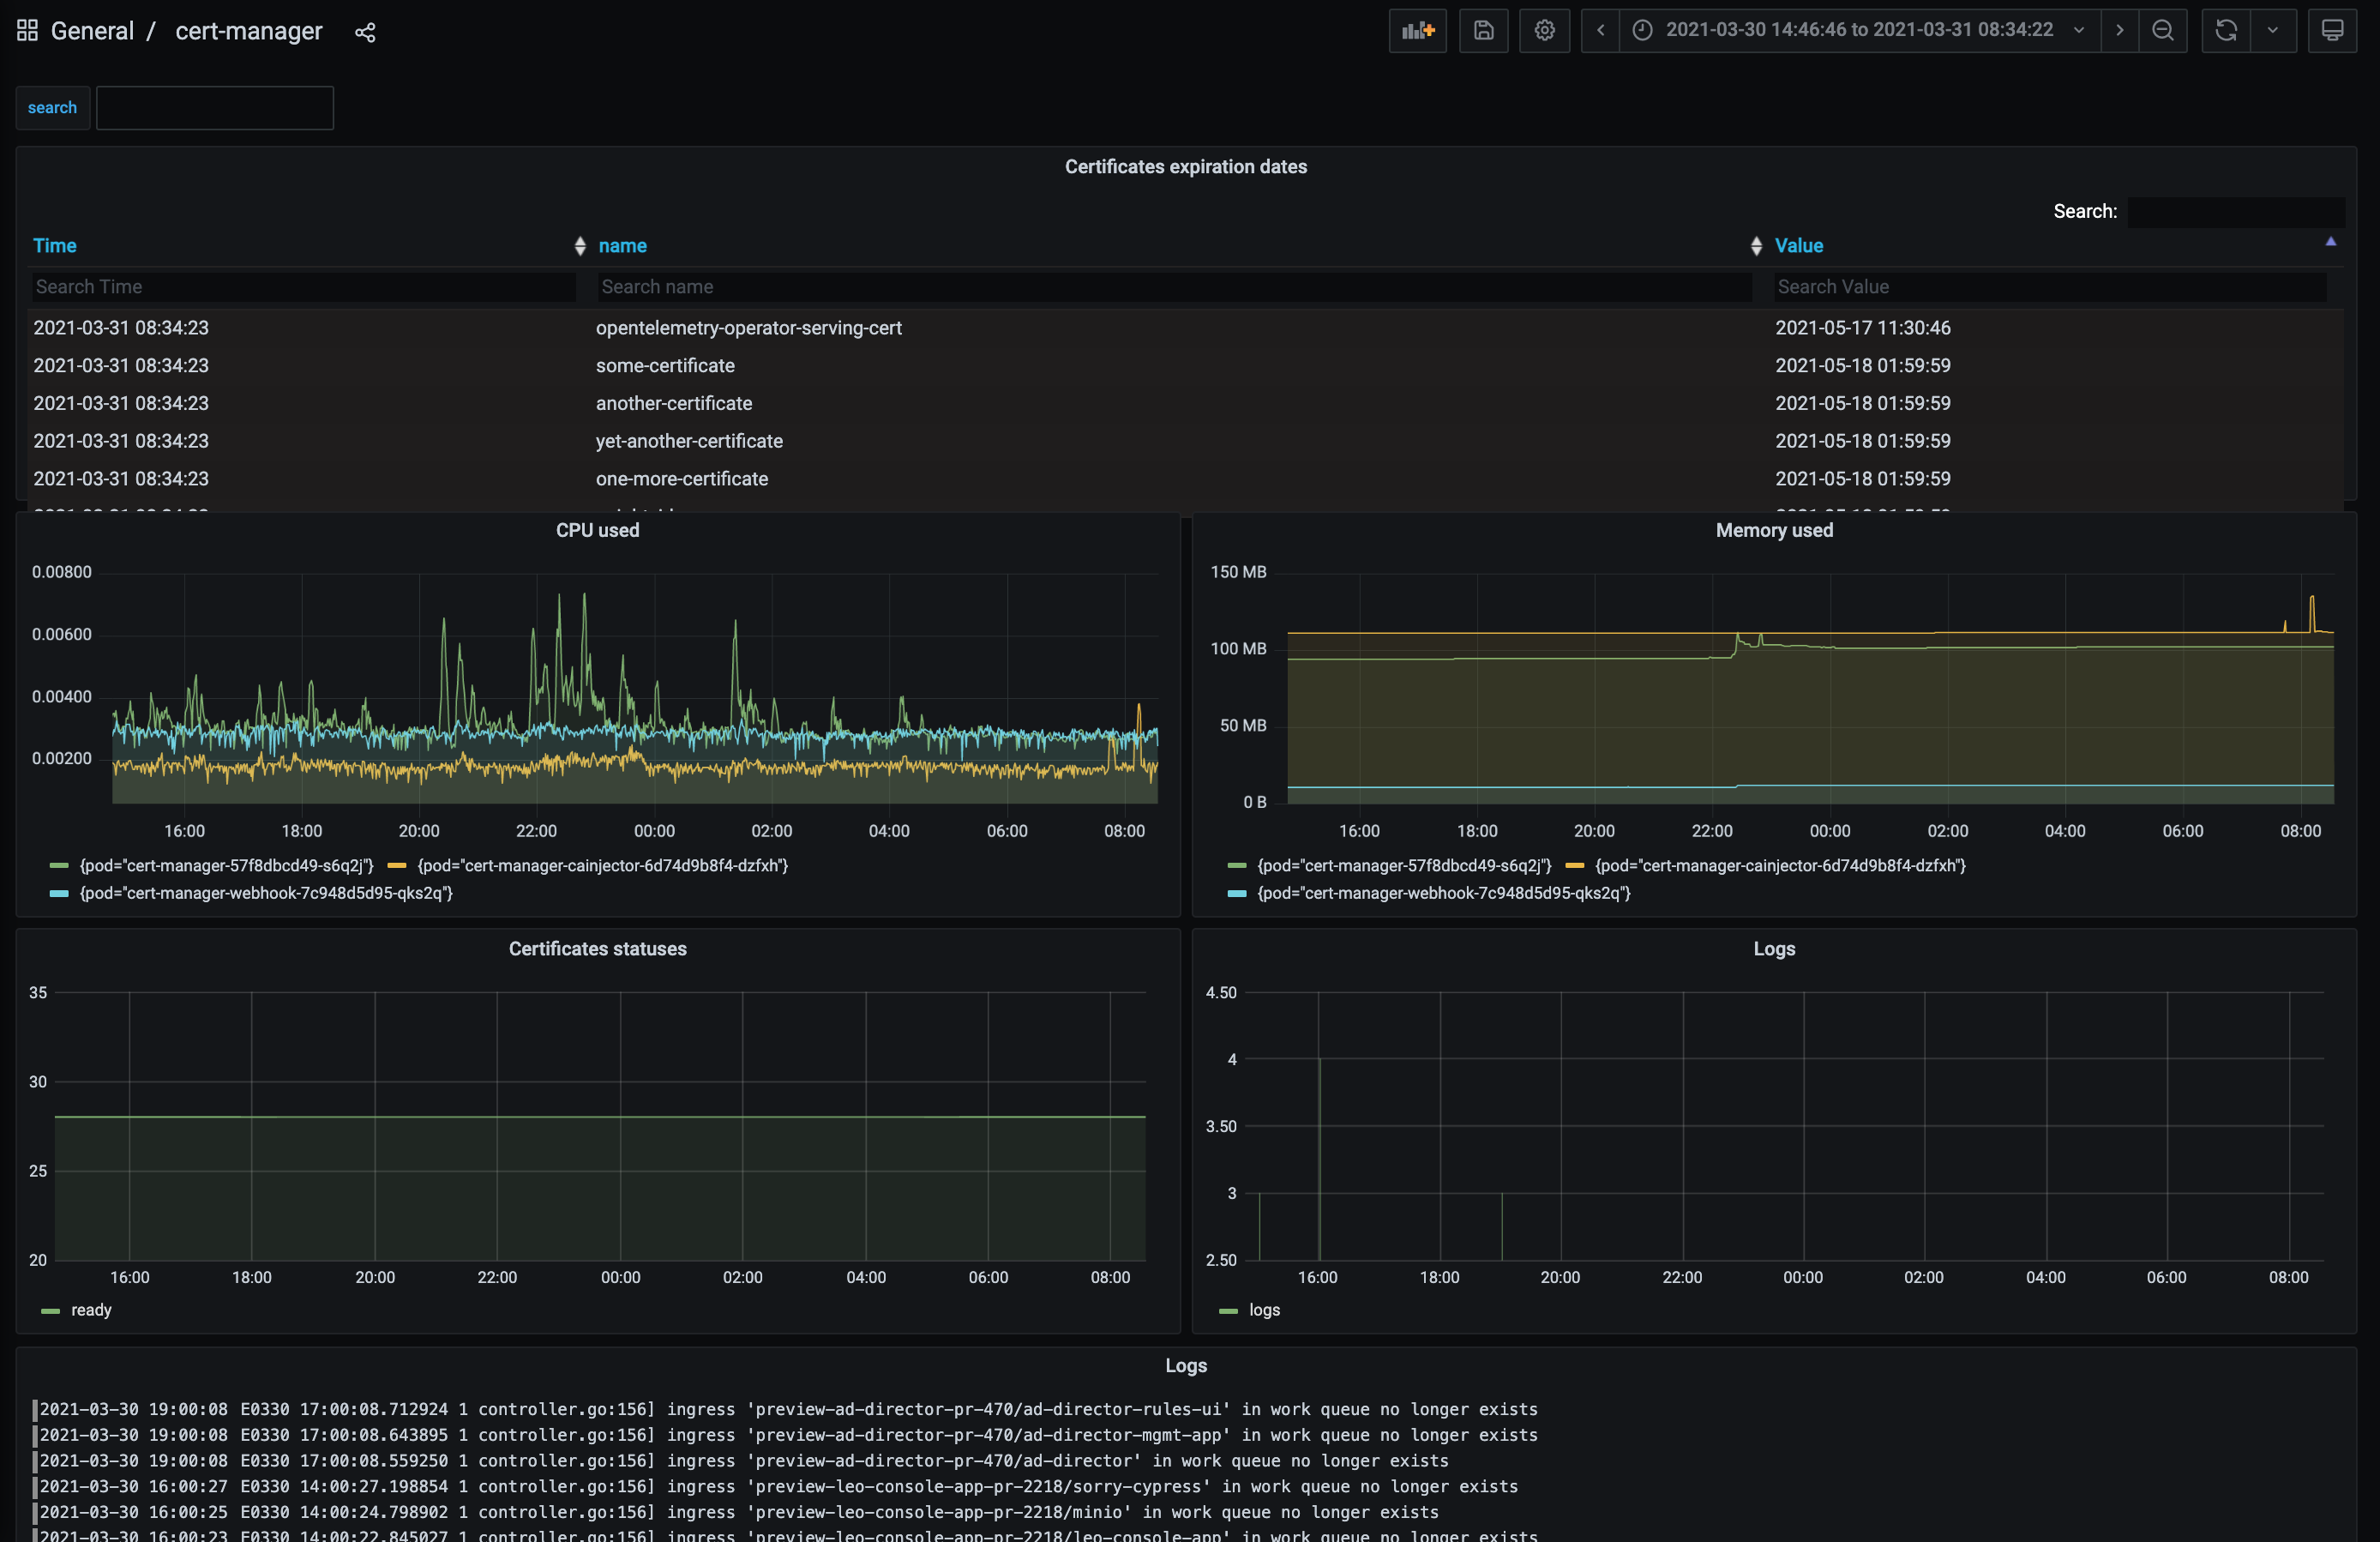
This is an example of a pre-defined dashboard, for cert-manager, where we display on the same dashboard metrics collected by Prometheus (including the certificates expiration dates) and logs collected by Loki/Promtail:
Configuration
The configuration is defined in “values files” stored in the Jenkins X Version Stream:
- Grafana configuration
- Loki configuration
- Promtail configuration
- Tempo configuration
- Prometheus configuration
If you want to change anything from the default configuration, you can either:
- submit a Pull Request if you believe this change is beneficial for everybody
- or create a new values file in your development environment git repository, in the
valuesdirectory- for example,
values/grafana/values.yamlfor Grafana, orvalues/prometheus/values.yamlfor Prometheus
- for example,
Next steps
Once the Grafana stack is installed and configured, you can:
- visualize pipelines traces from the Jenkins X Pipelines Visualizer
- install the Continuous Delivery Indicators addon
- expose Prometheus metrics from your own applications
- export traces from your own applications, using OpenTelemetry
- create Grafana dashboards for your applications
- contribute to the Jenkins X Grafana Dashboards
Feedback
Was this page helpful?
Glad to hear it! Please tell us how we can improve.
Sorry to hear that. Please tell us how we can improve.