Continuous Delivery Indicators
This guide will help you install, configure and use the Continuous Delivery Indicators addon in your Jenkins X cluster.
This addon will automatically:
- collect metrics from cluster events and git events: pull requests, pipelines, releases, deployments, …
- store them in a PostgreSQL database
- expose Grafana dashboards to visualize Continuous Delivery Indicators
This is an example of a pre-defined dashboard to visualize Continuous Delivery Indicators for a single repository (application):
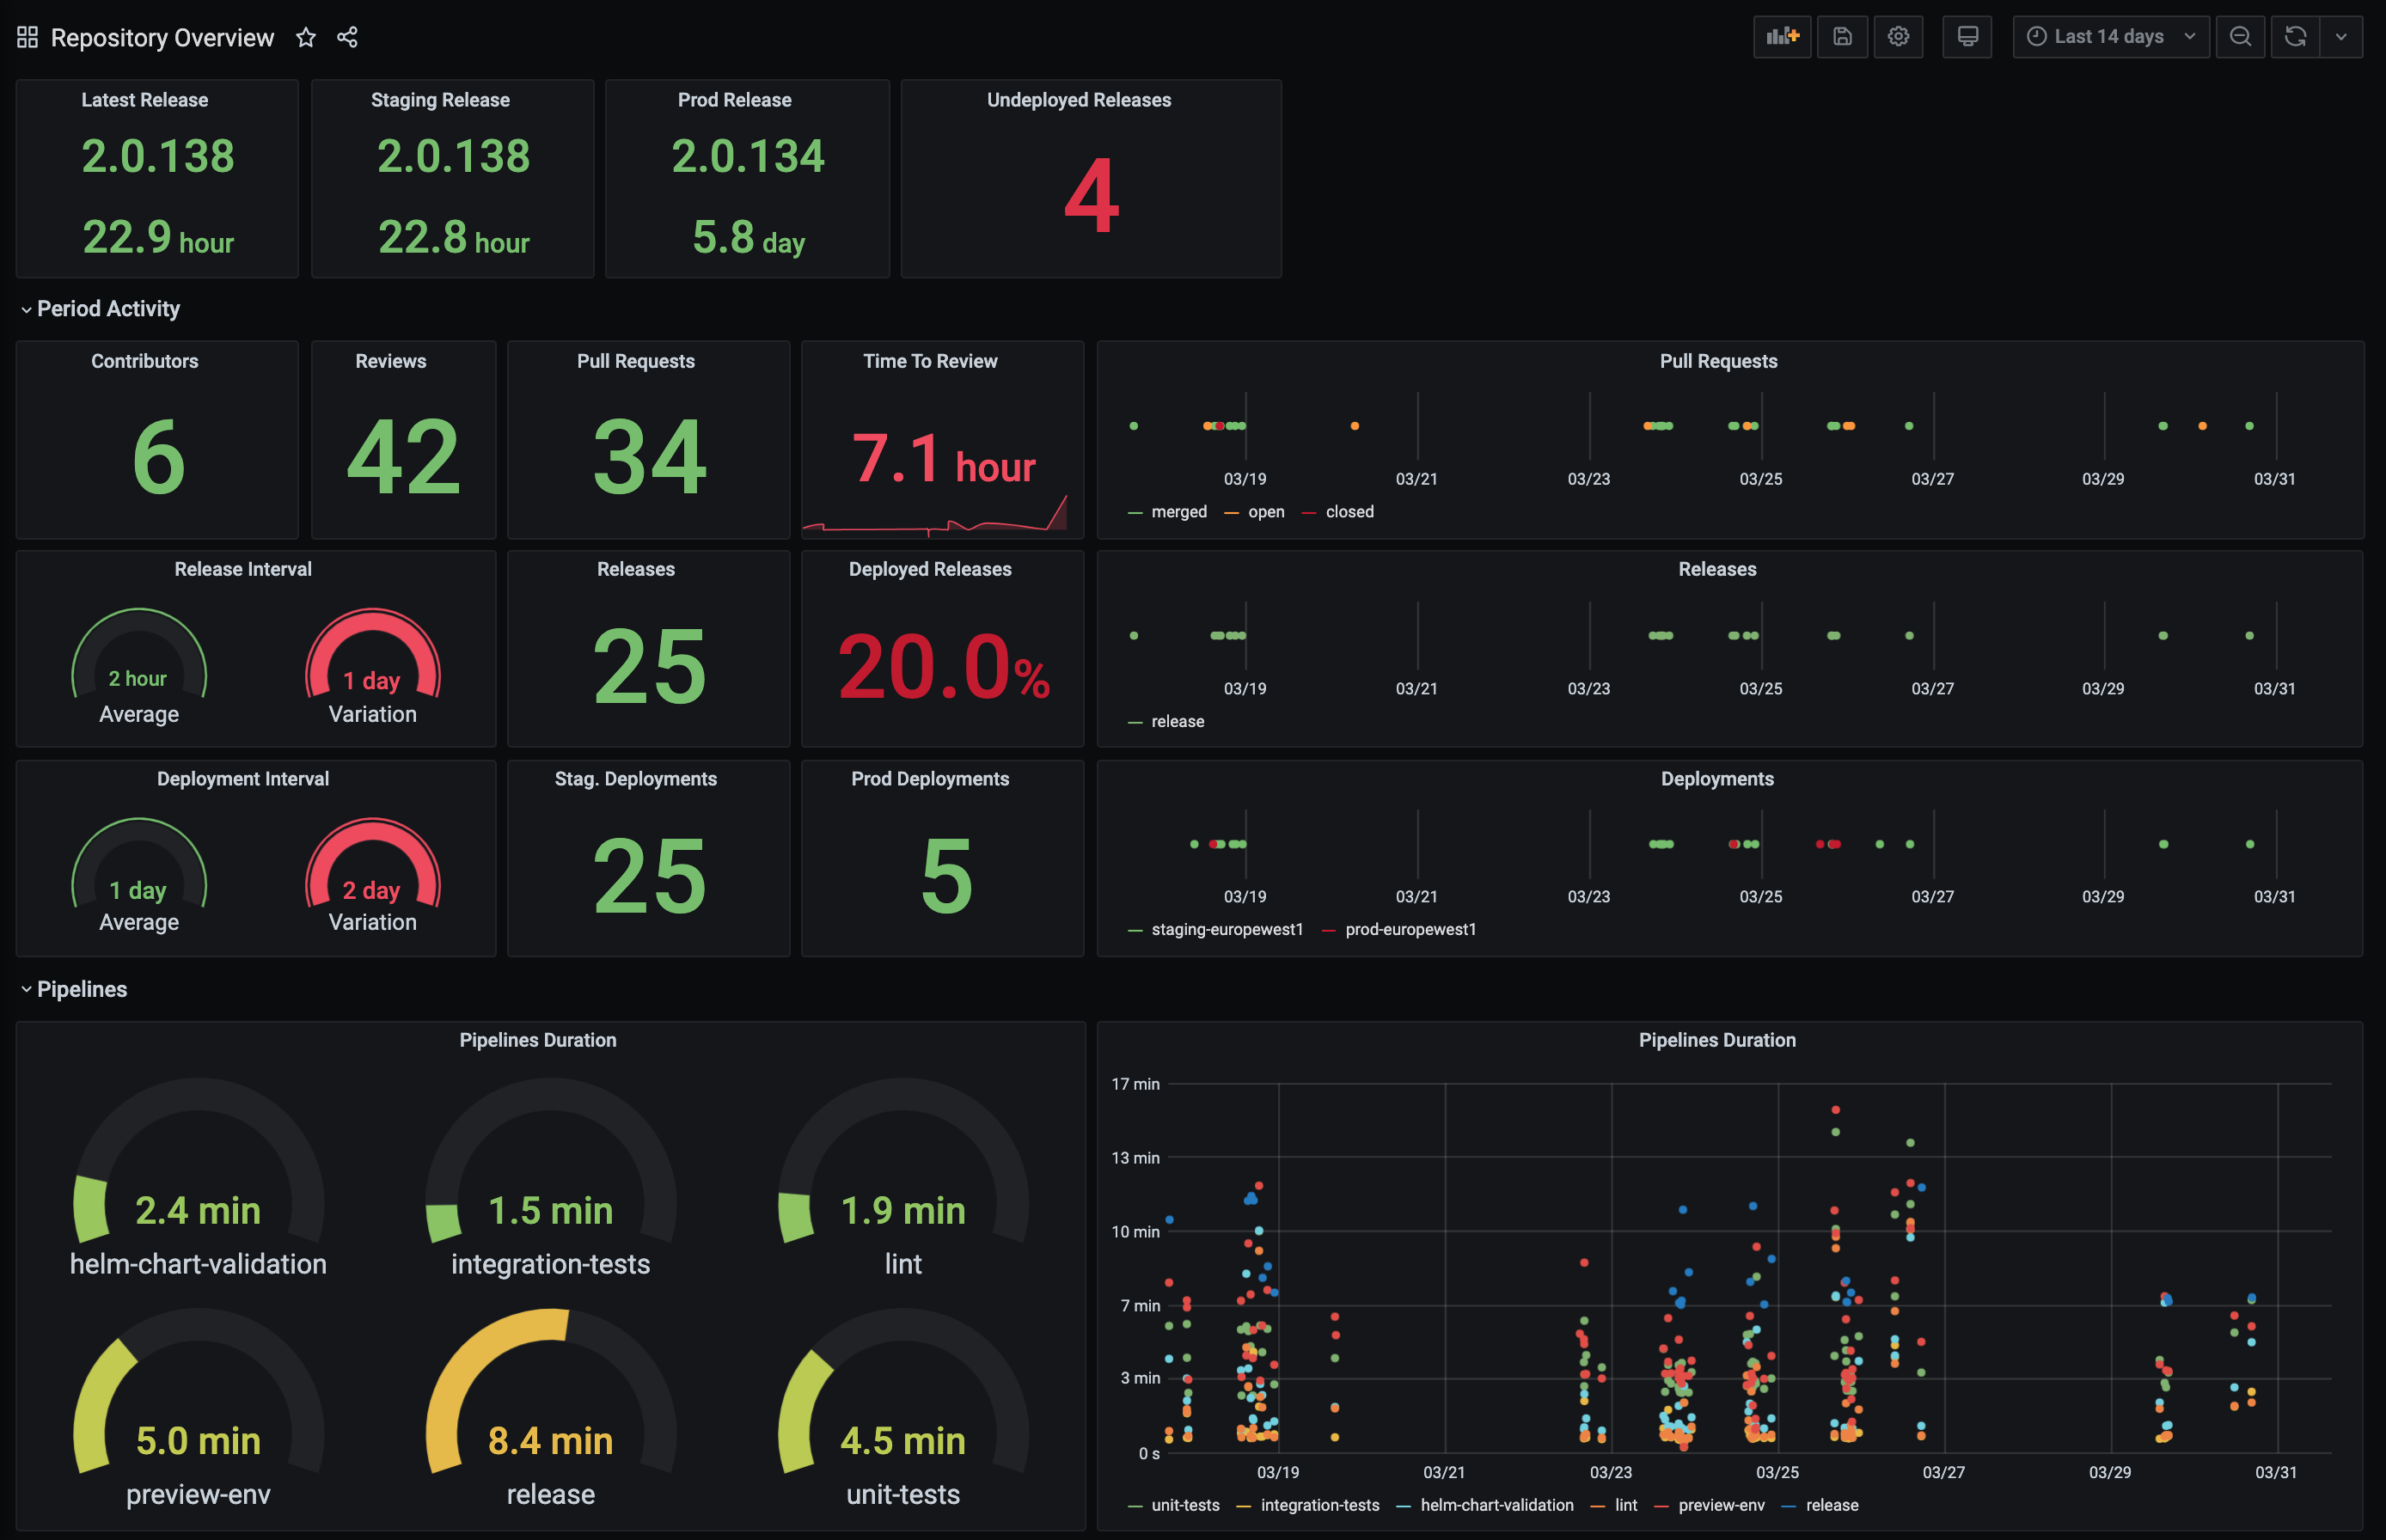
Installation
Note that this addon requires a running Grafana instance in your cluster, so you should install it first, using the platform observability guide.
Please follow the usual getting started guide for boot and helm 3 first.
Installing this addon is a 1 step operation: you need to edit the helmfiles/jx/helmfile.yaml file in your development environment git repository, so that it references the jxgh/cd-indicators chart, such as:
releases:
- chart: jxgh/cd-indicators
  name: cd-indicators
- chart: ...
...
Commit and push these changes, and after a few minutes you should see 2 new pods running in the jx namespace:
$ kubectl get pod -n jx
NAME                             READY   STATUS    RESTARTS   AGE
cd-indicators-57f85df9fb-fltjp   1/1     Running   0          13m
cd-indicators-postgresql-0       1/1     Running   0          13m
...
Usage
This addon will also expose:
- a Grafana datasource for the embedded PostgreSQL database - named
Indicators- in a Kubernetes Secret - multiple Grafana dashboards - with the
cd-indicatorstag - in Kubernetes ConfigMaps
The Grafana instance will automatically find these new resources and use them. So if you go to your Grafana URL, you should now see a new datasource and new dashboards. Of course, it might take a few hours/days/weeks to get enough data to get nice-looking dashboards.
You can either:
- enrich the existing dashboards, and submit Pull Requests on the cd-indicators github repository so that everybody can benefit from your improvements
- or create your own dashboards. We recommend that you store them in a git repository, and publish them as ConfigMaps in your cluster - see the cd-indicators github repository for an example.
And because we’re re-using the same Grafana instance which already has the Prometheus (metrics) and Loki (logs) datasources, you can build dashboards combining data from all sources, to get a complete overview of your application and its lifecycle: development, build, release, deployment, runtime.
Configuration
The configuration is defined in a “values file” stored in the Jenkins X Version Stream.
If you want to change anything from the default configuration, you can either:
- submit a Pull Request if you believe this change is beneficial for everybody
- or create a new values file in your development environment git repositor:
values/cd-indicators/values.yaml
You should at least configure the gitOwners, to ensure you will only collect metrics for your own repositories, and not for Jenkins X’s own applications - see the default values. In your values/cd-indicators/values.yaml file you can write:
config:
  gitOwners:
  - my_github_organization
Feedback
Was this page helpful?
Glad to hear it! Please tell us how we can improve.
Sorry to hear that. Please tell us how we can improve.