Traces for your pipelines
Categories:
Now that Jenkins X has solid integration with Grafana for its observability, it’s time to start building fun things!
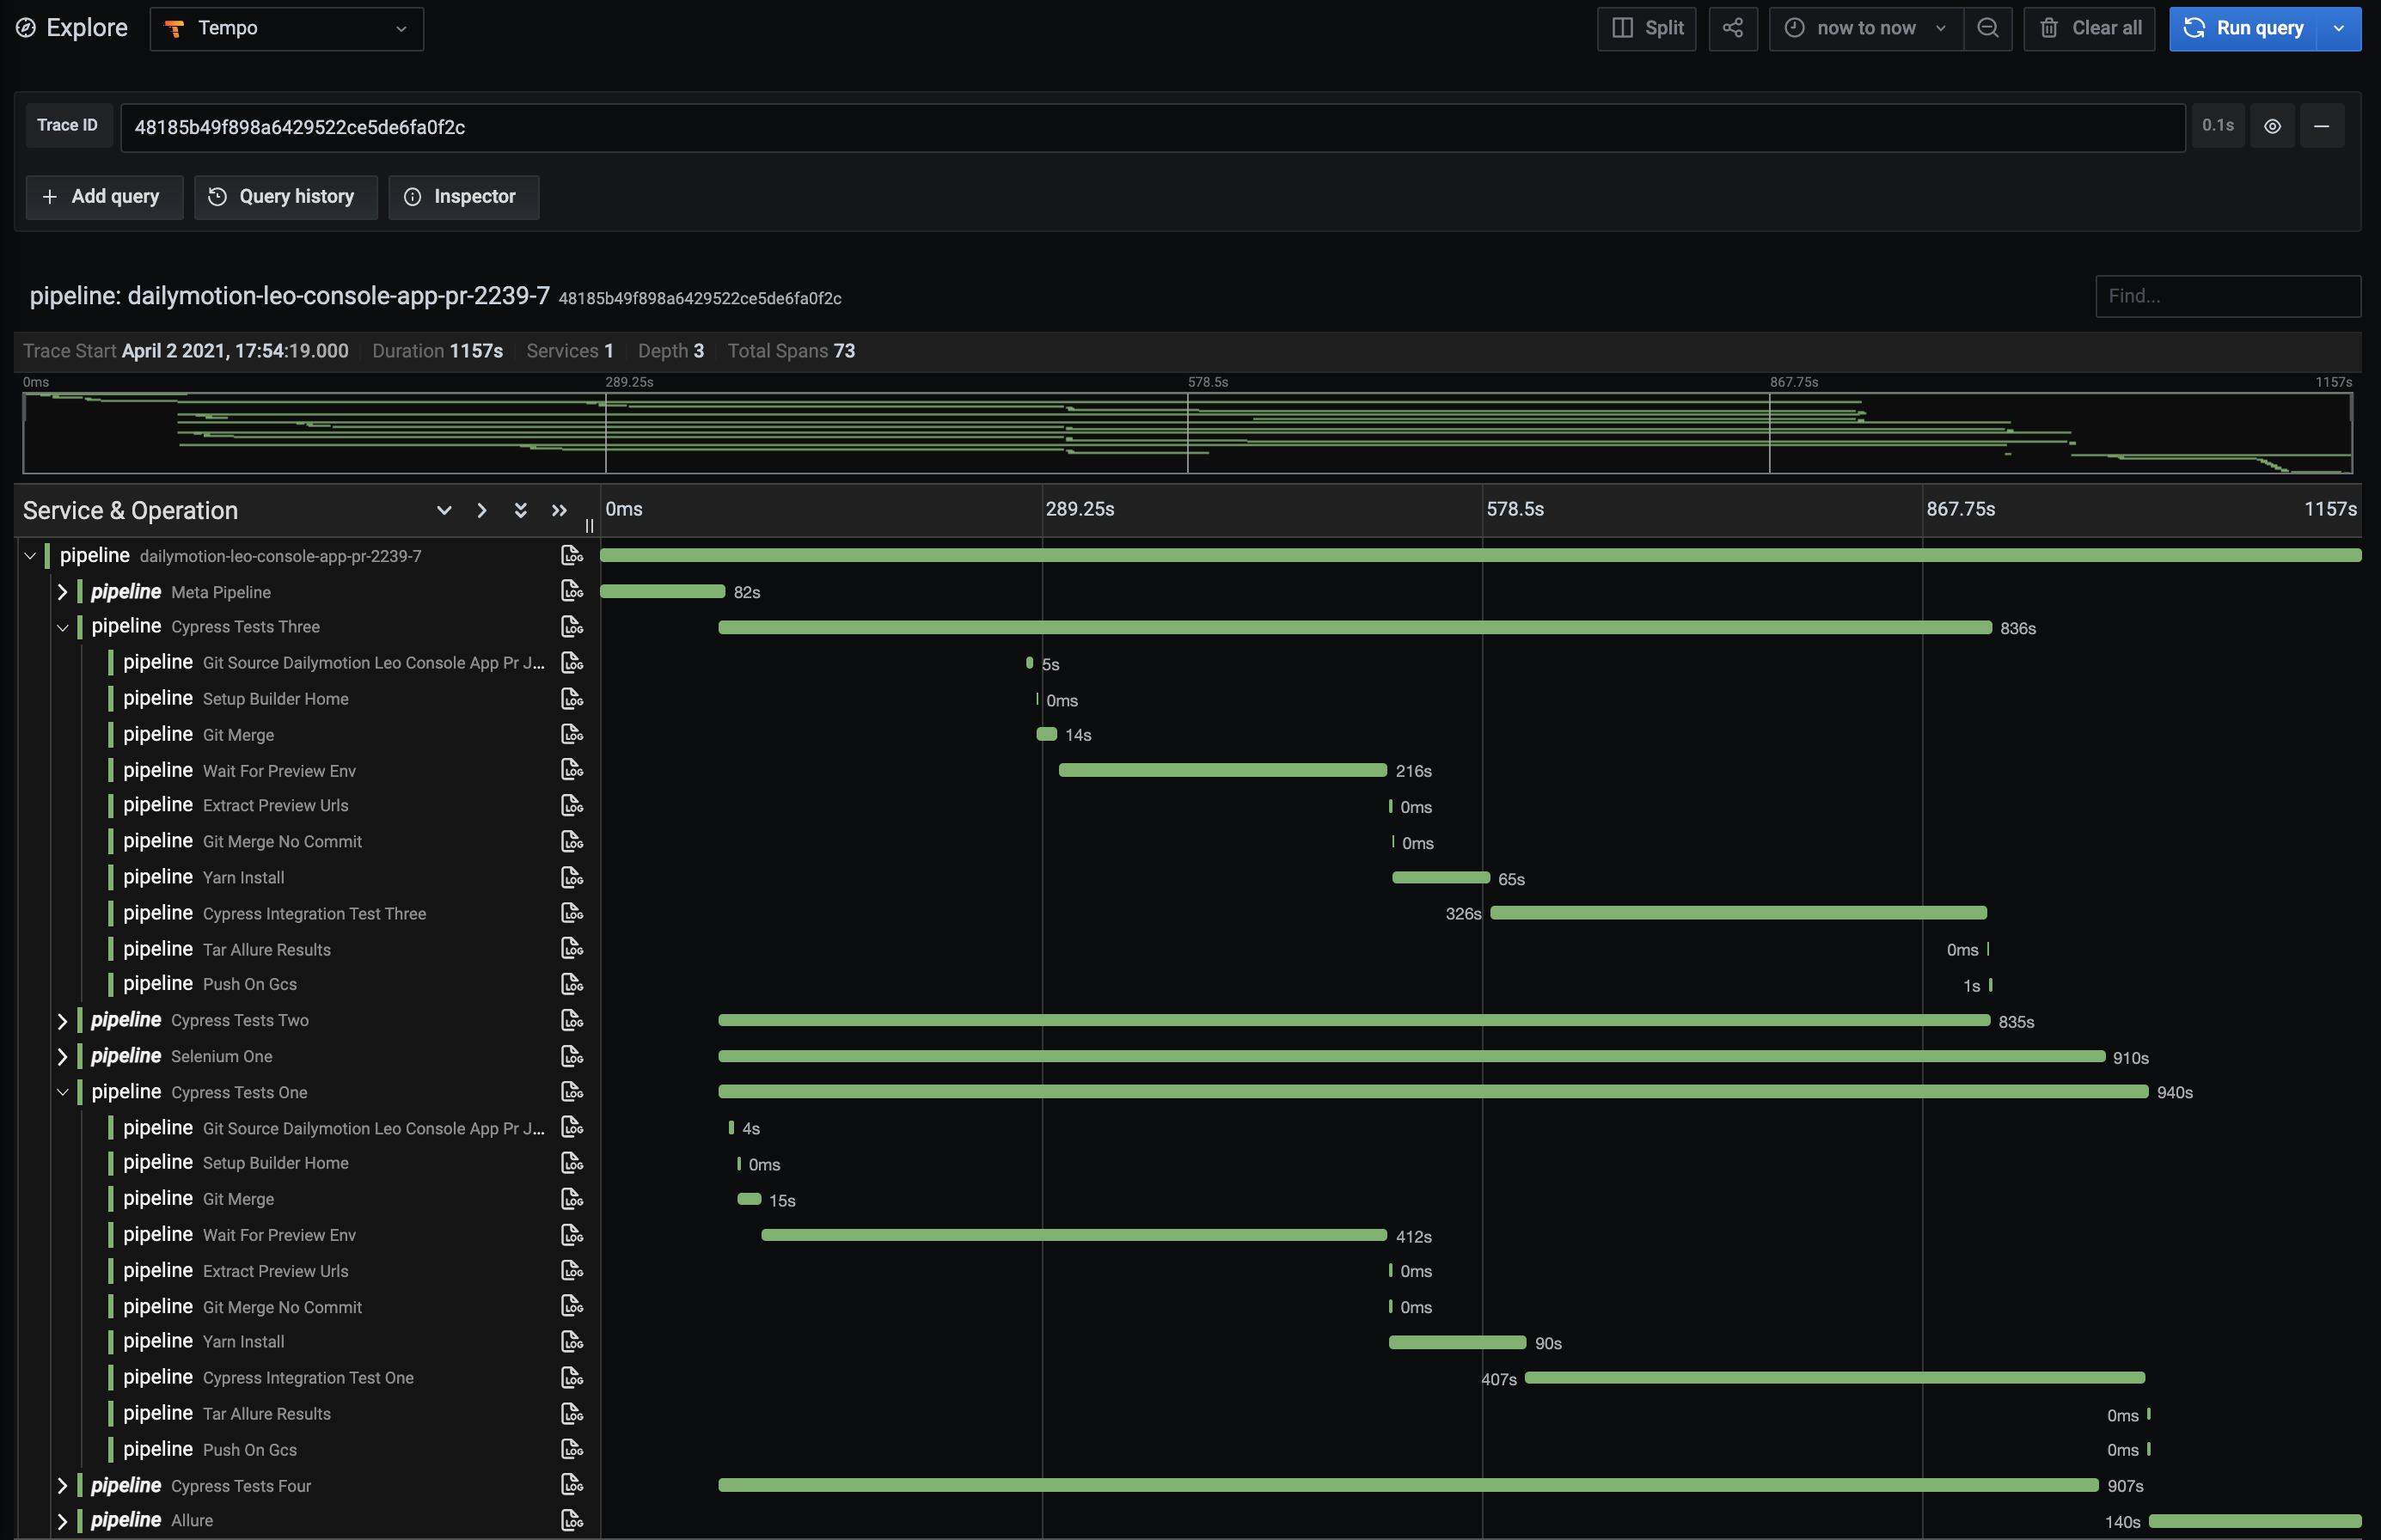
And the first one is tracing for all your pipelines:
With it, you can easily see the timings of all your pipelines, stages, and steps. This is great to inspect a “slow” pipeline and quickly see the slower steps.
We are using OpenTelemetry to generate a “logical” view of the pipeline, with 1 trace per pipeline and 1 span for each stage and step.
By default, these traces are ingested by Grafana Tempo. But if you prefer to export them to a different destination, it’s very easy, and thanks to the OpenTelemetry Collector you can export to a lot of different services. You can see the full list here and here.
The trace identifier is also stored in the pipeline itself so that the Jenkins X Pipelines Visualizer UI can link directly to the trace.
How can you benefit from it in your own Jenkins X cluster?
You just need to enable the observability stack, as explained in the observability admin guide.
Then, trigger a pipeline, and once it’s finished, go to the web UI, and click on the “Trace” button on the top-right. That’s it!
What’s next?
This is only the first step of native tracing support in Jenkins X. Stay tuned for more!