Jenkins X v3: now with built-in observability
Categories:
As a Continuous Delivery platform, Jenkins X has a central part in your infrastructure. If it becomes unstable or unusable, it will impact the whole software delivery of your organization.
This is why observability is a critical topic for Jenkins X, and work has started to get observability built-in for Jenkins X v3:
- Platform Observability: visualize logs and metrics for everything running in the Kubernetes cluster: Jenkins X’s own components - Tekton, Lighthouse, cert-manager, … - but also your own applications, that will be deployed either in preview environments or in the staging/prod environments.
- Continuous Delivery Indicators: visualize pull requests, pipelines, releases, and deployments metrics, collected from cluster events and git events.
We’re using Grafana as the central visualization component: the main entry point from which you can get a complete overview of both your application’s lifecycle - development, build, tests, releases, deployments, runtime - and your Continuous Delivery platform.
Platform Observability
Platform observability is not enabled by default for the moment, so the first step is to enable it, as explained in the platform observability admin guide.
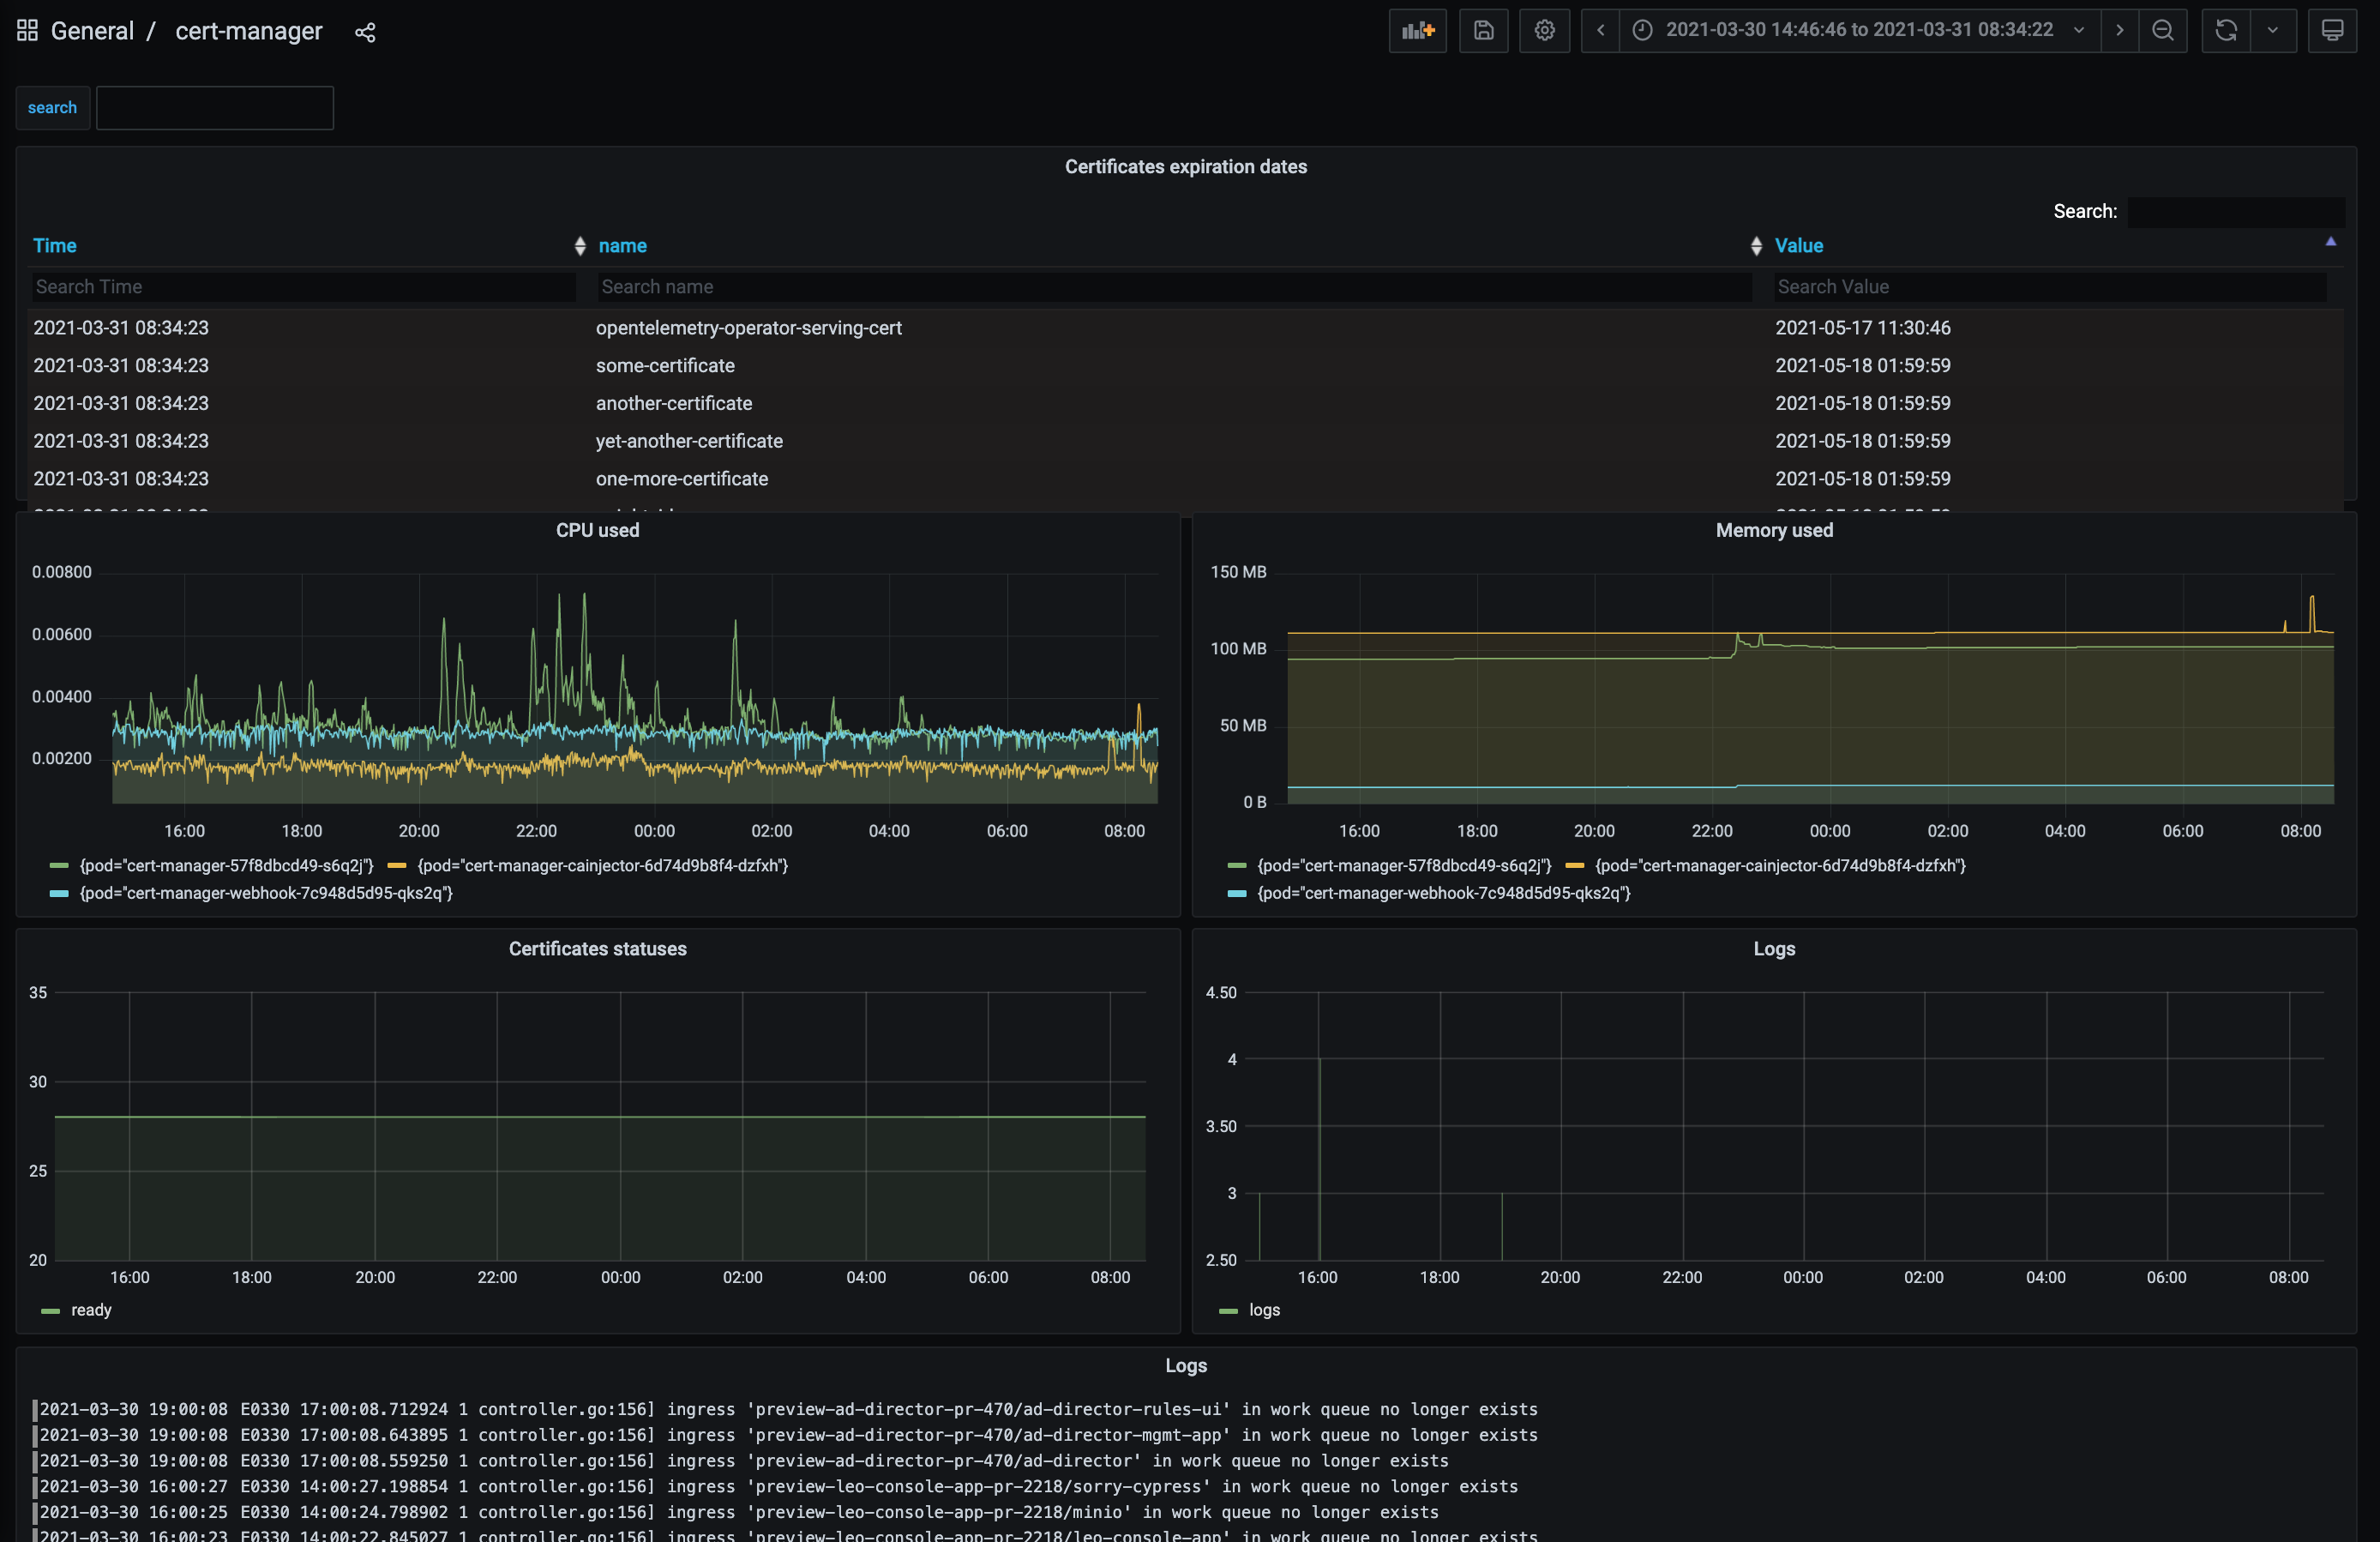
Once it’s done, you’ll get a running Grafana instance, pre-configured with data sources for applications logs - using Loki - and applications metrics - using Prometheus. But most important, it comes with a set of pre-defined Grafana dashboards for the main platform components: Tekton, Lighthouse, cert-manager, …
Here is an example of such a dashboard, using a mix of data sources to display cert-manager metrics collected by Prometheus - including the certificates expiration dates - and logs collected by Loki/Promtail:
Continuous Delivery Indicators
Continuous Delivery Indicators’ main goal is to give people insights into their workflows/processes so that they can continuously improve them. This is based on the DORA devops metrics and the SPACE framework.
The CD Indicators addon is not enabled by default for the moment, so the first step is to enable it, as explained in the continuous delivery indicators admin guide.
Once it’s done, you’ll get a running collector, along with a PostgreSQL database. The collector will listen for various events, both from the cluster and the git repositories, and store pull requests, pipelines, releases, and deployments data in the PostgreSQL database. The addon will also expose a new Grafana data source along with pre-configured Grafana dashboards, which will be picked up by your running Grafana instance.
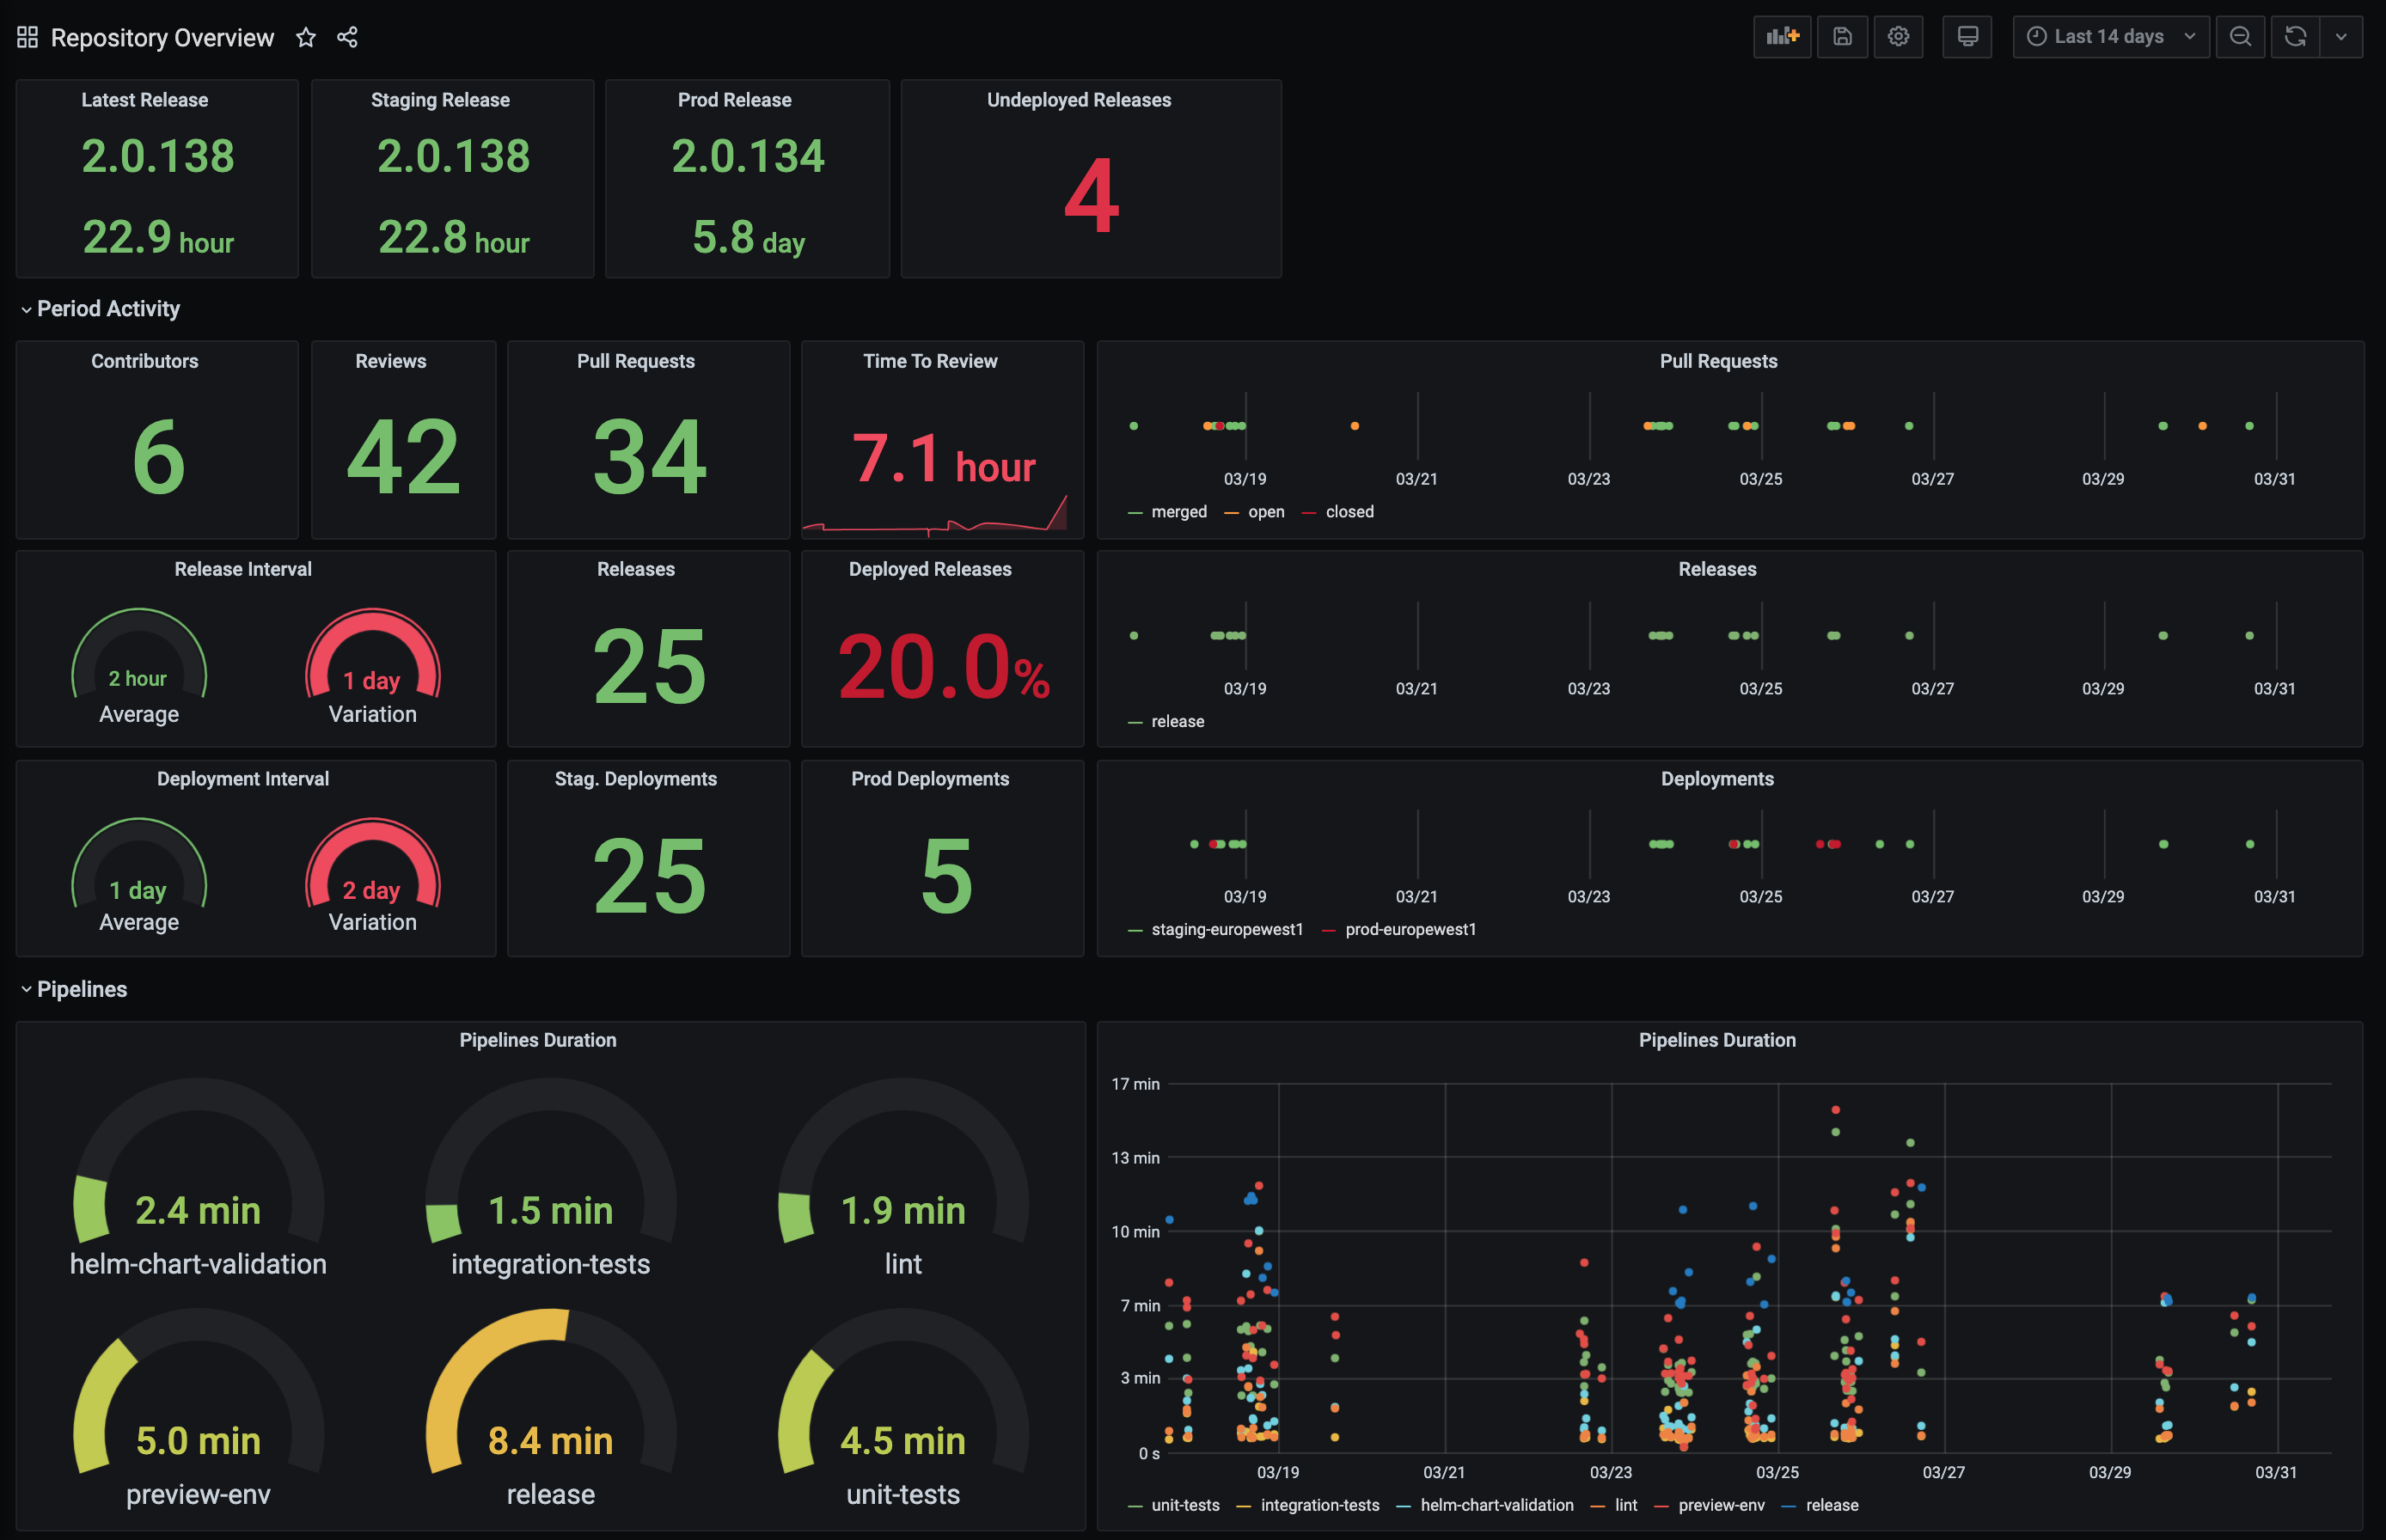
Here is an example of such a dashboard, displaying various indicators for a single repository/application: contributors, reviews, pull requests, releases, deployments, …
Roadmap
This is only the beginning! The next steps - in no particular order:
- configure alerting - using Prometheus alertmanager and Grafana alerting features - with a set of pre-defined alerts
- improve the dashboards
- enable it by default, so that users can benefit from it out of the box
Contributions are welcomed: